

Garden Rooms and Garden Offices: 100+ UK Statistics on Hybrid Working, Garden Space and Planning (2026)
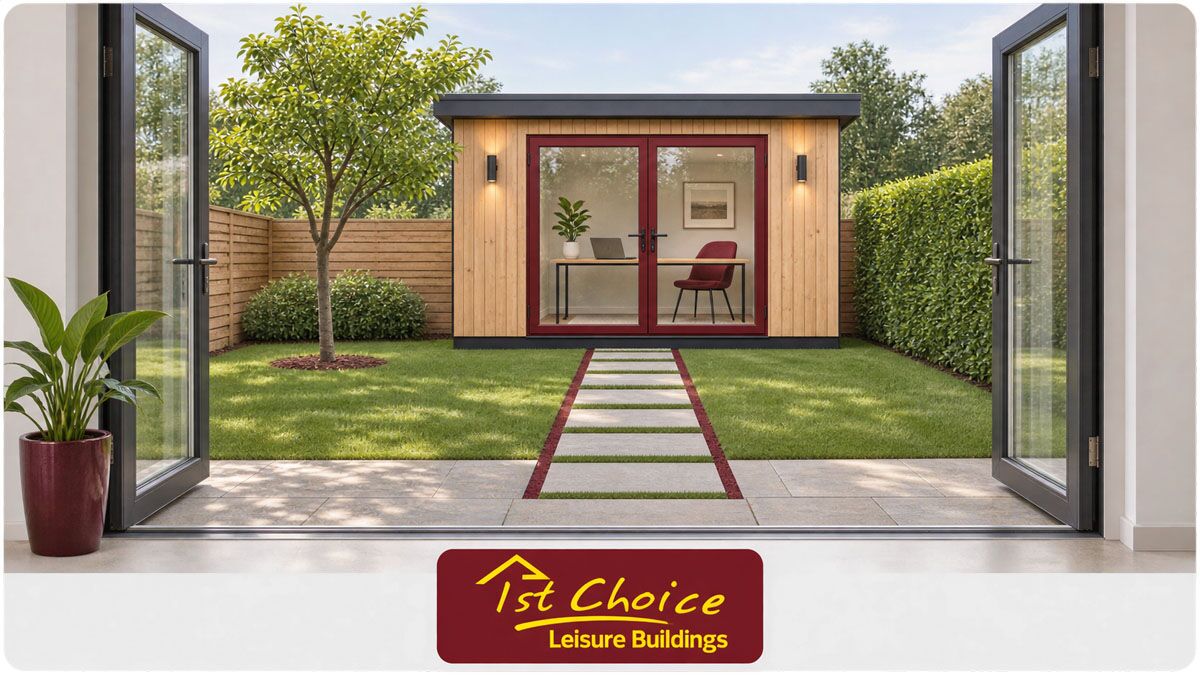
Over a quarter (28%) of adults who work in Great Britain now work hybrid and references to having a garden office have increased 11x in property descriptions compared to 10 years ago, according to ONS and Rightmove.
The obvious figure is misleading. “Work from home” tallies the number of people working from home each day. Hybrid working is on the rise: working from home some days and in the office on others.
This page looks at most of the key figures when it comes to garden offices. From how many people work from home, how many people have a garden and its size, changes in demand and what the planning statistics show.

Top Picks
Home and hybrid working
- Hybrid working: 28% of working adults in Great Britain hybrid worked in the latest ONS survey
- High earners: 45% of workers earning £50,000 or more hybrid work, against 8% of those under £20,000
- Graduates: 41% of workers with a degree hybrid work, 10 times the 4% with no qualifications
- Commute saved: home workers saved an average of 56 minutes a day by not travelling, per the ONS Time Use Survey
- Businesses: 16.7% of UK businesses use, or plan to use, increased homeworking permanently; London is highest at 22.7%
Gardens
- No garden: 12% of households in Great Britain have no private or shared garden, rising to 21% in London
- Garden size: the median garden for a house in Great Britain is 188 square metres; in London it is 140
Demand for garden offices
- Listings: garden office mentions in homes for sale are 11 times higher than a decade earlier, up 1,046%
- Summer houses: listing mentions up 90%, while conservatory mentions fell 52%
- Searches: ‘garden office’ drew 726,000 Google searches at the pandemic peak and 396,000 two years later
Planning
- Householder decisions: 145,600 householder planning applications decided in England in a year, 90% granted
- Speed: 93% of householder applications were decided within 8 weeks or the agreed time
- Height limit: a permitted development outbuilding within 2 metres of a boundary may be no taller than 2.5 metres
- Building Regulations: a detached building up to 15 square metres with no sleeping accommodation is exempt
How many people in the UK work from home or hybrid?
28% of those who work in Great Britain worked hybrid in the survey week, according to the ONS’ Opinions and Lifestyle Survey.”
They did so on a hybrid basis:
- Hybrid: 28% of those who worked did so from home and had a workplace they also went to
- Trend: Hybrid working has been growing little by little since the ONS started asking this question, as the number of people who travel to work has fallen
- Work for someone else: 30% hybrid worked, vs 24% of those self employed
- Work full time: 34% of those who work full time hybrid worked, vs 18% who worked part time
- Based on: A sample size of 5,494 who work, over the course of one quarter
What these numbers mean:
| Measure | Figure | What it counts | Source (data date) |
|---|---|---|---|
| Hybrid workers | 28% | Worked from home and travelled to work in the past seven days | ONS Opinions and Lifestyle Survey (8 January to 30 March 2025) |
| Employees hybrid working | 30% | Hybrid share among employees | ONS OPN (8 January to 30 March 2025) |
| Self-employed hybrid working | 24% | Hybrid share among the self-employed | ONS OPN (8 January to 30 March 2025) |
| Full-time workers hybrid working | 34% | Hybrid share among full-time workers | ONS OPN (8 January to 30 March 2025) |
| Part-time workers hybrid working | 18% | Hybrid share among part-time workers | ONS OPN (8 January to 30 March 2025) |
Of the three arrangements, it’s the only one that has increased. Working from home only has remained fairly stable.
One thing to note is that if you have worked from home in the past 7 days and also commuted to work, you will be classed as hybrid working. This includes non consistent patterns of working.
“Working from home” is misleading as many people work from home on some days of the week.
28% of workers who live in Great Britain have worked hybrid.
What type of people are likely to hybrid work?
As mentioned before, if your salary is higher, you are more likely to work hybrid. Those with salaries over £50,000 were more likely to work hybrid; 45% did compared to 8% of people who make less than £20,000 per year.
The divide runs along income, education, age and job type:
| Group | Share hybrid working | Source (data date) |
|---|---|---|
| All working adults | 28% | ONS OPN (8 January to 30 March 2025) |
| Income £50,000 or more | 45% | ONS OPN (8 January to 30 March 2025) |
| Income under £20,000 | 8% | ONS OPN (8 January to 30 March 2025) |
| Degree or equivalent | 41% | ONS OPN (8 January to 30 March 2025) |
| Below degree level | 21% | ONS OPN (8 January to 30 March 2025) |
| No qualifications | 4% | ONS OPN (8 January to 30 March 2025) |
| Aged 30 to 49 | 36% | ONS OPN (8 January to 30 March 2025) |
| Aged 16 to 29 | 19% | ONS OPN (8 January to 30 March 2025) |
| Aged 50 to 69 | 24% | ONS OPN (8 January to 30 March 2025) |
| Full-time | 34% | ONS OPN (8 January to 30 March 2025) |
| Part-time | 18% | ONS OPN (8 January to 30 March 2025) |
| Employees | 30% | ONS OPN (8 January to 30 March 2025) |
| Self-employed | 24% | ONS OPN (8 January to 30 March 2025) |
| Disabled workers | 24% | ONS OPN (8 January to 30 March 2025) |
| Non-disabled workers | 29% | ONS OPN (8 January to 30 March 2025) |
| Least deprived areas, England | 32% | ONS OPN (8 January to 30 March 2025) |
| Most deprived areas, England | 24% | ONS OPN (8 January to 30 March 2025) |
Qualifications make a huge difference, graduates are 10x more likely to work hybrid than those with none.

Which jobs and households hybrid work most?
The data from last year also includes job and household data, with 45% of managers, directors and senior officials working hybrid, compared to 27% of all workers.
| Group | Share hybrid working | Source (data date) |
|---|---|---|
| Managers, directors and senior officials | 45% | ONS OPN (10 April to 30 June 2024) |
| All workers | 27% | ONS OPN (10 April to 30 June 2024) |
| Elementary occupations | 3% | ONS OPN (10 April to 30 June 2024) |
| Caring, leisure and other services | 3% | ONS OPN (10 April to 30 June 2024) |
| Working parents | 35% | ONS OPN (10 April to 30 June 2024) |
| Working non-parents | 24% | ONS OPN (10 April to 30 June 2024) |
| Male working parents | 41% | ONS OPN (10 April to 30 June 2024) |
| Female working parents | 30% | ONS OPN (10 April to 30 June 2024) |
Most are in management or professional jobs, and a few work in retail or care jobs.
Education, as you can imagine, plays a large role in who is able to work hybrid. Almost 9 in 10 workers with a degree fall under these four categories: manager, professional, associate professional and office jobs.
These are your typical workers who work hybrid: they have a degree, are between the ages of 30-49, are a manager/professional and earn over £50,000.
45% of people who earn over £50,000 work hybrid, ONS
How much time do we save by working from home?
On average we save 56 minutes when we work from home, this is due to not travelling to work, according to the ONS Time Use Survey.
A portion of that time was spent resting or exercising, here is how that looked:
- More sleep and rest: On average 24 minutes more when working from home than when working away from home
- Exercising, sports and other health and wellbeing activities: People exercised 15 minutes more when working from home
- Better work life balance: 78% said that working from home has allowed them to have a better work life balance
- Fewer distractions: 53% of people who worked from home had fewer distractions, 52% said they could get their work done quicker
- Increased wellbeing: 47%
- Downside: It was harder to work with other people, 48%
Something to note about the previous findings, they were only measured over weekdays for those who work over 7 hours. There may have been a slight decrease in time spent working, but the ONS cannot confirm this.
The findings on work life balance and less distractions came from a survey conducted when everyone was working from home during the pandemic. So this would be people that worked from home for the first time, rather than working hybrid.
Working from home allows you to gain back approximately one hour on days you work from home.
Will working from home become permanent for UK businesses?
16.7% of businesses have increased homeworking as part of their business, or will do so in the future. This number is higher in London, standing at 22.7% according to the ONS Business Insights and Conditions Survey.
Here are some readings of that survey:
| Reading | Businesses using or planning permanent homeworking | Source (Data Date) |
|---|---|---|
| Latest dataset, all UK businesses | 16.7% | ONS BICS Dataset Wave 163, (17th – 30th August 2026) |
| Latest bulletin reading | 20% | ONS BICS Bulletins, Wave 151, (16th Feb – 1st March 2026) |
| After work-from-home guidance lifted | 23% | ONS BICS, (4th – 17th April 2022) |
| First pandemic autumn | 16% | ONS BICS, (16th – 29th November 2020) |
The ONS stated that these numbers have remained similar over the last three years, up to their latest reading. The ONS have added a disclaimer that responses can vary from region to region and wave to wave, if responses are low it may have affected the numbers.
Here is where homeworking is most popular:
| Nation/Region | Percentage of businesses that will/have increased homeworking as part of their business |
|---|---|
| London | 22.7% |
| South East | 19.8% |
| South West | 18.5% |
| Scotland | 18.3% |
| Yorkshire & Humber | 18.3% |
| North West | 18.1% |
| East of England | 17.7% |
| Wales | 17.2% |
| England | 17.1% |
| West Midlands | 16.7% |
| East Midlands | 16.7% |
| UK | 16.7% |
| North East | 16.3% |
| Northern Ireland | 13.5% |
Source (data date): ONS Business Insights and Conditions Survey, Wave 163 dataset, final results, percentage of surveyed businesses not permanently stopped trading, 17 to 30 August 2026.
As you can see, London tops every nation and region, with Northern Ireland coming last.
Here are some reasons why businesses want to allow homeworking:
- Staff Wellbeing: 68.1% of businesses that allow, or will allow, homeworking stated this was a reason why
- Recruiting more staff: Allowing staff to work from home means that businesses can recruit from more areas across the UK, 44.7% stated this as a reason why
- Increase productivity / Lower overheads: 38.2% said their productivity had increased, while 34.0% said they could reduce overhead costs
- Not allowing homeworking: When asked why businesses didn’t want to allow homeworking, 70.1% said it wasn’t suitable for their business and 26.2% stated it would have a negative impact on work culture
It largely depends on what type of industry you are in:
| Industry | Businesses with hybrid working | Percentage of businesses that will/have increased homeworking as part of their business |
|---|---|---|
| Information and Communication | 49% | 54% |
| Professional, Scientific and Technical Activities | 42% | Not specified |
| Construction | Not specified | 5% |
| Accommodation and Food Service Activities | 4% | 3% |
Source (data date): hybrid working column, ONS BICS, 1 to 31 December 2023, weighted by employment; permanent homeworking column, ONS BICS, 4 to 17 April 2022, weighted by count.
Most businesses that have jobs done at a desk will allow hybrid working, while jobs that are on-site or involve working with customers will not.
Please note that both columns are asking different questions, so read down not across the columns.
About one sixth of UK businesses have decided to allow their staff to work from home, London had the highest percentage and staff wellbeing was the top reason.
How many UK homes have a garden, and how big are they?
Around 1 in 8 households (12%) in GB don’t have a garden of their own or one they share, and the median garden size for a house is 188 square metres. This is from an ONS look at Ordnance Survey data.
The amount of homes without gardens, and how large they are, varies greatly across different areas.
| Area | % of households with no garden | Median size of garden for a house |
|---|---|---|
| Great Britain | 12% | 188 sq m |
| London | 21% | 140 sq m |
| Scotland | 13% | 226 sq m |
| City of London (local authority) | not published | 16 sq m |
| Na h-Eileanan Siar (local authority) | not published | 727 sq m |
Source (data date): ONS, One in eight British households has no garden, analysis of Ordnance Survey map data, published 14 May 2020.
As you can see, the least number of homes with gardens are in London and the smallest. Scotland has the largest.
Who don’t have a garden, based on data collected by Natural England and analysed by the ONS:
- Occupation: 20% of people who are in a semi-skilled or unskilled manual job, casual work or unemployed have no garden, compared to 7% in a management, administrative or professional job
- Age: Only 8% of those who are 65 or over have no private outdoor space
- Living in London: Gardens in London are on average 26% smaller than the Great Britain average
These are the median sizes for houses, not all homes, and were released by the ONS during the first lockdown. There has been no data released since, so we will be using these figures for this article.
Something to note is that the data on who doesn’t have a garden includes people who have no private or shared garden, based on data from Ordnance Survey. When looking at ethnicity and occupation, this data includes people who have no outside space, including patios and balconies, from data collected by Natural England.
Most houses in the UK have enough garden space to build a garden office, but over a fifth of Londoners do not have one.
188 square metres is the median garden size for a house, based on ONS data.
How popular are garden offices?
Homes for sale that mention a garden office have increased by 11 times over the last 10 years, an increase of 1,046%. Making it the fastest-rising home feature in listings, according to Rightmove.
Rightmove also showed us what features have become more and less popular over the last decade:
| Home feature | Difference in listings mentioning this feature over the last decade |
|---|---|
| Garden office | +1,046% |
| Bifold doors | +589% |
| Orangery | +173% |
| Underfloor heating | +114% |
| Summer house | +90% |
| Open plan | +74% |
| Dining room | -28% |
| Fitted wardrobes | -29% |
| Greenhouse | -46% |
| Conservatory | -52% |
Source (data date): Rightmove press release, proportion of agent listings mentioning each feature, June 2022 compared with June 2012.
You can see that garden offices and summer houses have become more popular, while conservatories and greenhouses have decreased.
Google Searches
According to Legal & General, the number of Google searches for ‘garden office’ reached a high of 726,000 during the pandemic, before dropping down to 396,000 two years later.
- At its highest, there were 726,000 searches
- The year after, there were 486,000
- Two years after, 396,000. This is still 22% higher than the year before the pandemic
- Searches for ‘hybrid working’ increased from an average of 120 per year to nearly 119,000 per year
Again, we only know how many properties have a garden office mentioned on the listing, we do not know how many people have built one. We can’t get this data because you don’t need to submit an application to build a garden office if it’s within the Permitted Development limits, so it won’t appear in our planning data below.
Garden offices have gone from being rarely mentioned on a home, to the fastest-rising home feature in listings over the last decade.
Properties with a garden office: Increased by 1,046% over the last decade, according to Rightmove.
Do I need planning permission to build a garden room in England?
You do not need to submit a planning application for a garden room, as long as it stays within the Permitted Development limits. If your building is within 2 metres of a boundary, it must be no taller than 2.5 metres.
Permitted Development, Class E, allows you to build a garden office if:
| Condition | Permitted Development rules, Class E |
|---|---|
| Size | Your building, along with any enclosures and containers, cannot take up more than 50% of your garden, not including the size of your house |
| Must not be built | In front of a wall that forms the main elevation of your house |
| Number of storeys | Can only be 1 storey |
| Maximum height | If your roof is dual pitched, you can build 4m high |
| If your building is within 2m of your boundary | It must be no taller than 2.5m |
| Any other case | Can be up to 3m high |
| Eaves | Must be 2.5m or lower |
| Cannot build a | Verandah, balcony or raised platform |
| If you live in a listed building | There are no permitted developments that can be built within the curtilage of a listed building |
| If you live in an Area of Outstanding Natural Beauty, the Broads, National Park or a World Heritage Site | Any buildings more than 20 metres from the wall of your house, cannot be bigger than 10 square metres |
| On Article 2(3) land, such as conservation areas | You cannot build anything between a side elevation of your house and the boundary |
Source: The Town and Country Planning (General Permitted Development) (England) Order 2015, Schedule 2, Part 1, Class E, revised text on legislation.gov.uk.
If you meet all of the above requirements, you don’t need to apply for planning permission.
Building Regulations
If your building is under 30 square metres, you will not need to comply with Building Regulations, as long as the following conditions are met:
- Must be a detached building, one storey, and not contain any sleeping accommodation
- No part of the building must be less than 1 metre away from a boundary, or it must be constructed mainly from non-combustible material
Any detached building that is under 15 square metres and does not contain any sleeping accommodation will not need to comply with Building Regulations.
Under Class E, you are allowed to build something on your property that is required for a purpose incidental to the enjoyment of the dwellinghouse“. It will be decided by your local council whether your home office classifies as this or not. If you plan to run a business from your garden office, you may not be able to use it for that purpose.
Please note that these rules are only applicable in England; Wales and Scotland have different rules.
You don’t need to apply for planning permission to build a garden office, as long as it meets the above criteria.
How many planning applications are decided in England?
In the year leading up to June, district councils across England decided on 145,600 householder planning applications, and granted 90% of them.
You can see that householder applications make up half of the applications that councils decide on.
| Quarter | Number of householder applications decided on | Householder applications as a percentage of all applications decided |
|---|---|---|
| Jan-March 2025 | 36,200 | 51% |
| Apr-June 2025 | 44,000 | 54% |
| Jul-Sept 2025 | 38,700 | 51% |
| Oct-Dec 2025 | 35,600 | 49% |
| Jan-March 2026 | 33,500 | 49% |
| Apr-June 2026 | 37,700 | 51% |
Source (data date): MHCLG, Planning applications in England, quarterly factsheets for January 2025 to March 2026 and the April to June 2026 statistical release (published 24 September 2026).
The most householder applications are decided in the quarter of April-June, and the least in the winter months. We can also see that the most recent quarter has had fewer decided, than the same quarter in the previous year.
For the most recent quarter and year, we can see:
- 37,700 householder applications were decided, making up 51% of all decisions made
- 91% of householder applications were granted, over the most recent quarter, and 90% for the year
- 92% of householder applications were decided within 8 weeks, or an agreed time frame, over the quarter, and 93% for the year
- Householder applications made up 50% of all applications decided, over the year
- 78,700 applications were received, and 74,500 were decided, over the most recent quarter
- 88% of all applications decided, were granted, over the most recent quarter
- Over the year, 314,200 applications were received, and 254,100 were granted, which is 87% of decisions
- Across all application types, the share of decisions granted ranged from 84% in London, to 92% in the North East
- 6,000 applications for prior approval, were received, and 81% were approved
- 57% of the applications that required prior approval, were large householder extensions
The MHCLG states that householder developments are, “developments to a residence which require planning permission such as extensions, loft conversions and conservatories“. So, you will only find your garden room here if it’s above the Permitted Development limits.
As we said before, some garden rooms will not need to notify the council, so they will not appear in these stats; “there is no way of capturing this data” says the MHCLG.
Nine in ten householder planning applications are granted, and most are decided within 8 weeks.
90% of householder planning applications were granted in the last year, according to the MHCLG.
Conclusion
With 28% of workers now hybrid working, and 16.7% of businesses allowing it, it’s clear to see that people want the ability to work from home. Graduates, managers, and those on higher incomes, aged between their 30s and 40s, are the most likely to hybrid work.
Most houses have a big enough garden to fit a garden office, and as long as you stay within the Permitted Development rules, you don’t need to apply for planning permission.
We have seen from the Rightmove data, that garden offices have become increasingly popular, so why not take advantage?
Sources
Office for National Statistics, Who has access to hybrid work in Great Britain? (11 June 2025) | Office for National Statistics, Who are the hybrid workers? (11 November 2024) | Office for National Statistics, Is hybrid working here to stay? (23 May 2022) | Office for National Statistics, Business insights and impact on the UK economy: 5 March 2026 | Office for National Statistics, Business insights and impact on the UK economy dataset, Wave 163 (3 September 2026) | Office for National Statistics, One in eight British households has no garden (14 May 2020) | Ministry of Housing, Communities and Local Government, Planning applications in England: April to June 2026 (24 September 2026) and quarterly factsheets (January to March 2025, April to June 2025, July to September 2025, October to December 2025, January to March 2026) | Rightmove, Dining rooms decline and orangeries on the rise (12 August 2022) | Legal & General Surveying Services, Garden offices here to stay (17 July 2023) | The Town and Country Planning (General Permitted Development) (England) Order 2015, Schedule 2, Part 1, Class E | The Building Regulations 2010, Schedule 2, Class 6
